Sometimes you want to monitor resource usage of the Pods deployed in your namespaces. Personal Monitoring application allows you to do so in a few easy steps. The application creates a personal Prometheus instance that collects all metrics from your namespace and displays them in a personal Grafana instance located on web address pmon-[namespace].dyn.cloud.e-infra.cz.
Installation
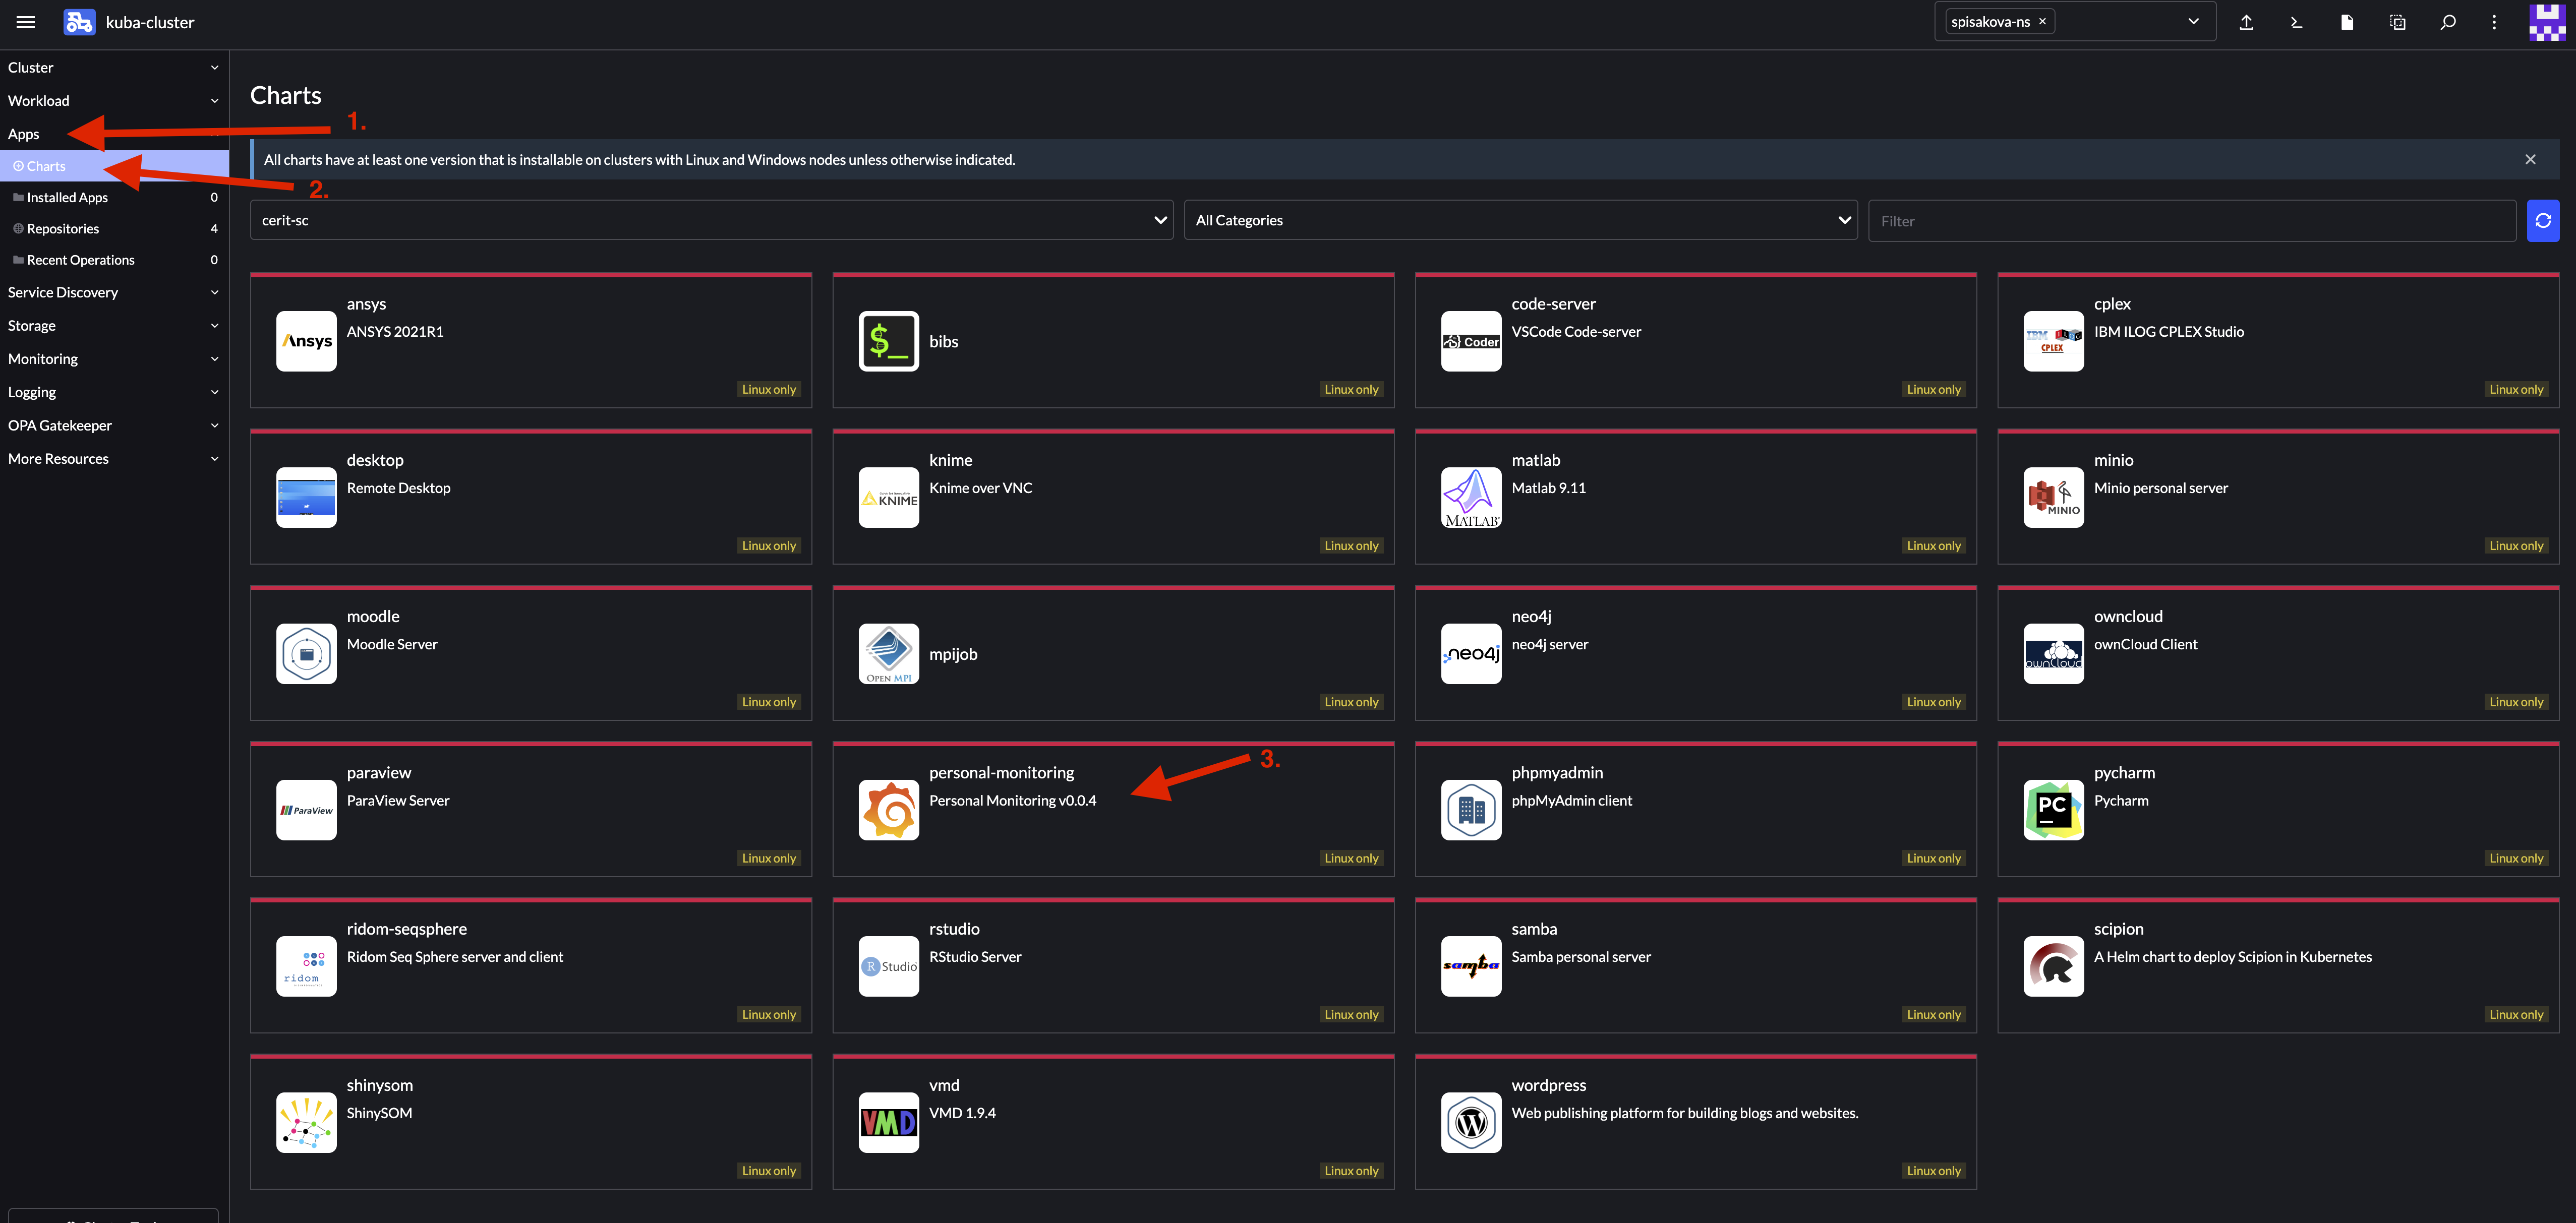
Start with choosing Personal Monitoring application from Rancher application menu.
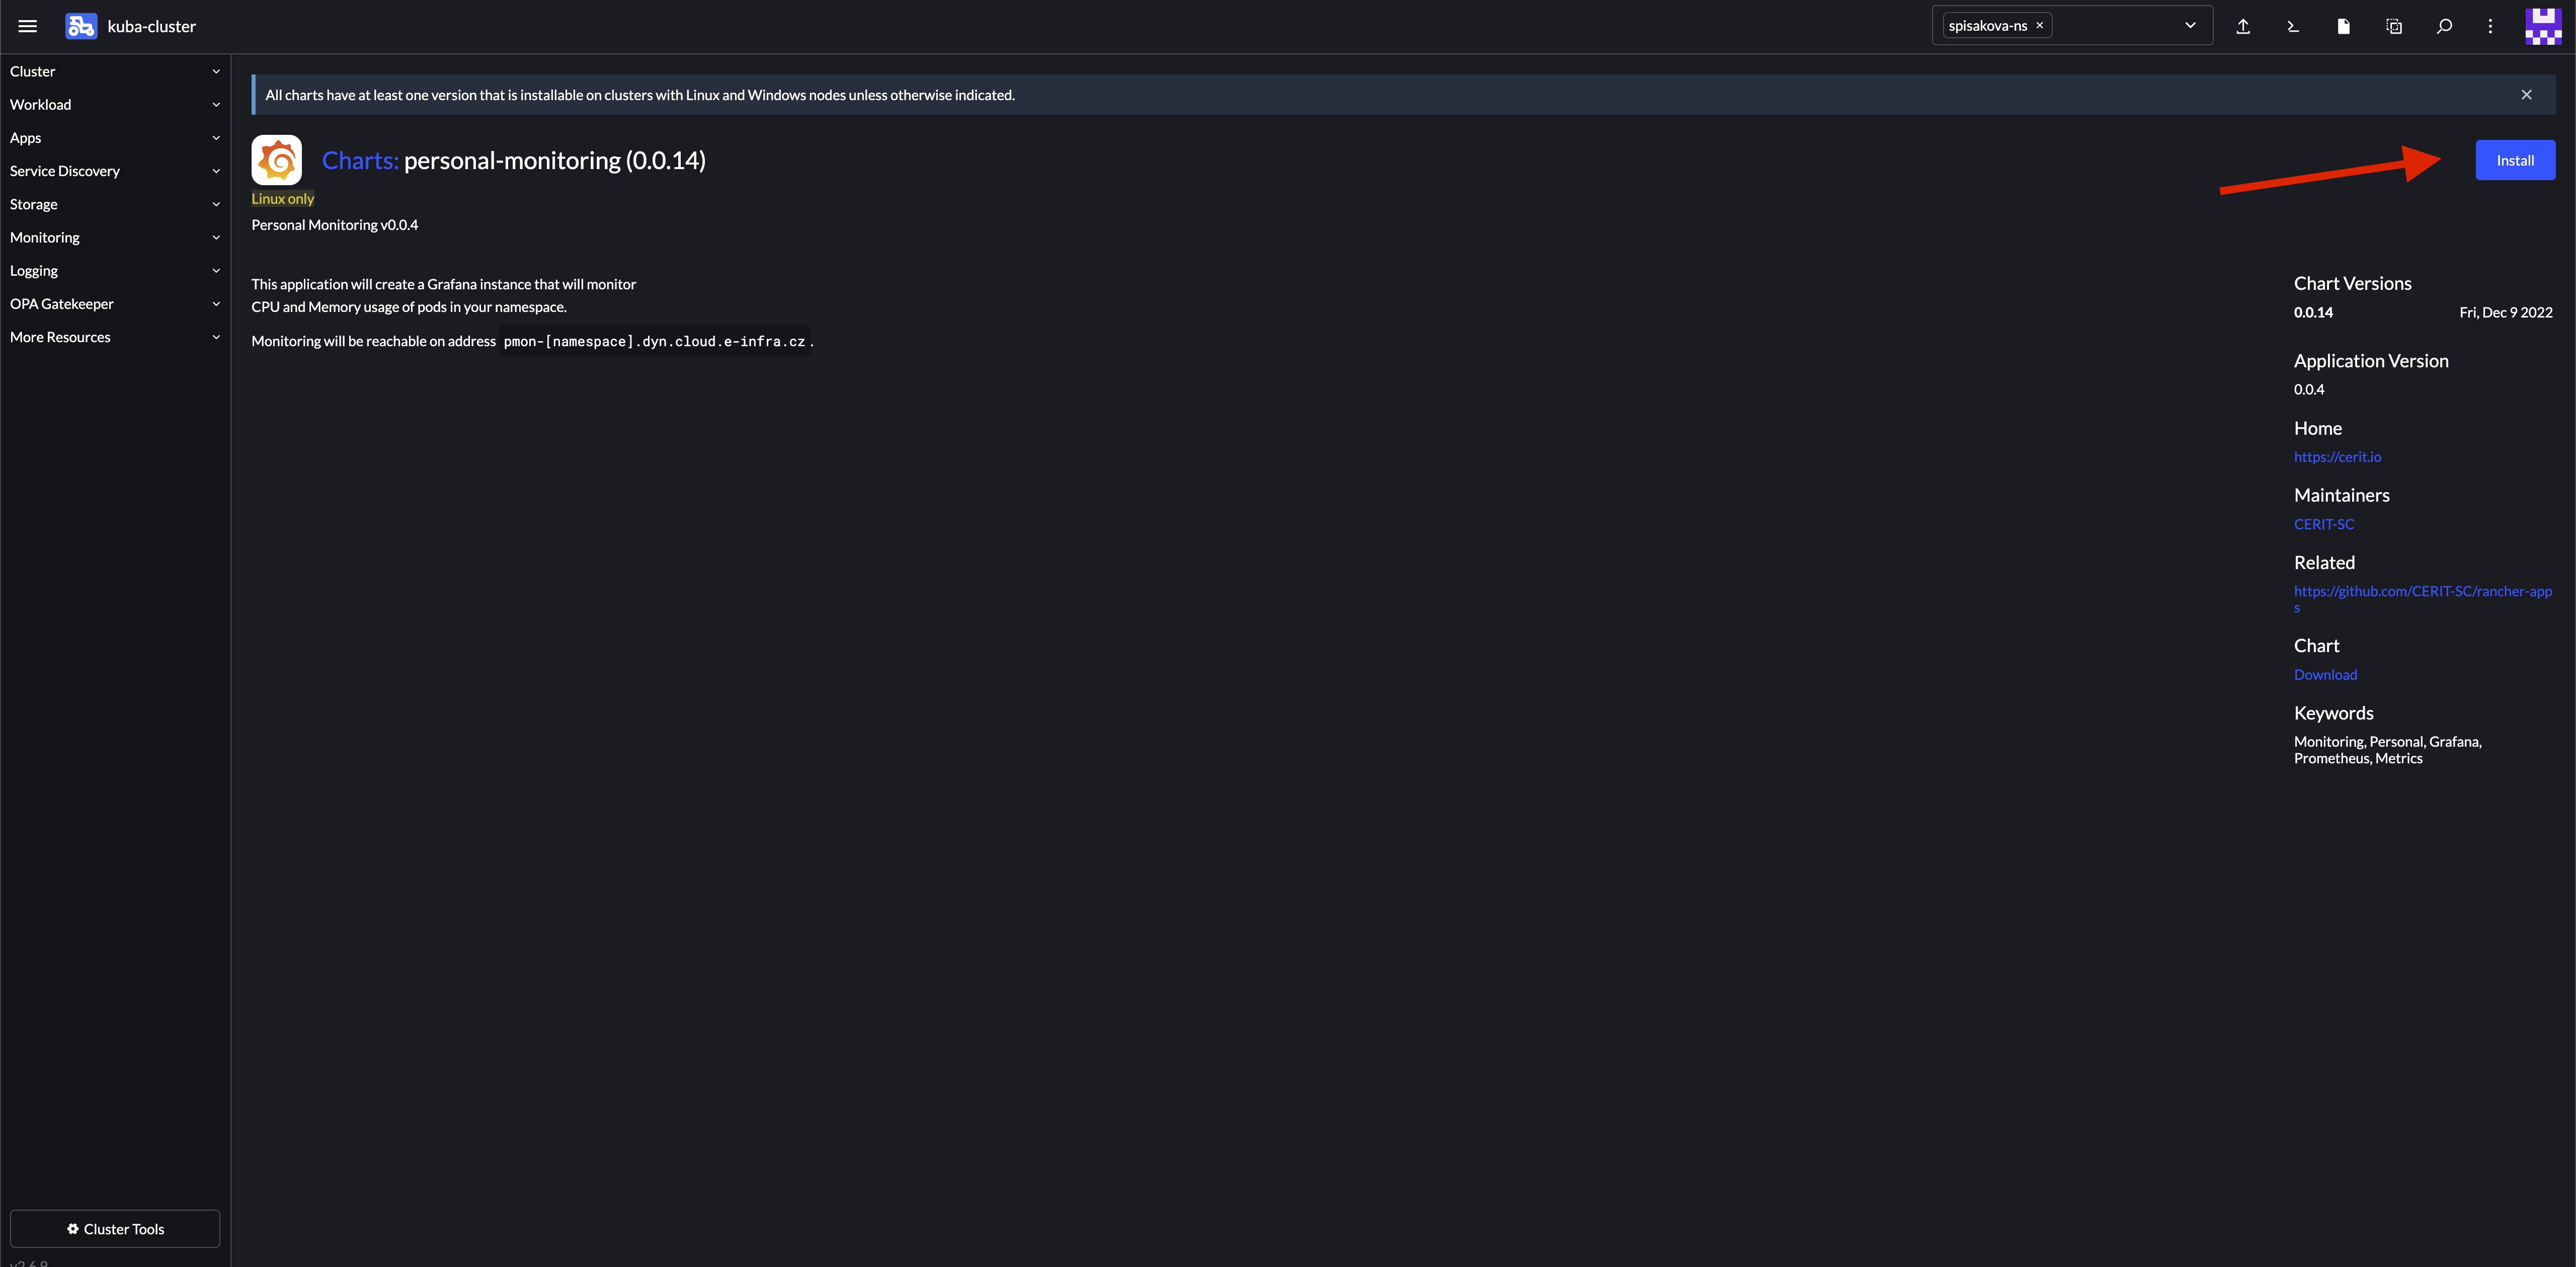
After choosing, click on Install.
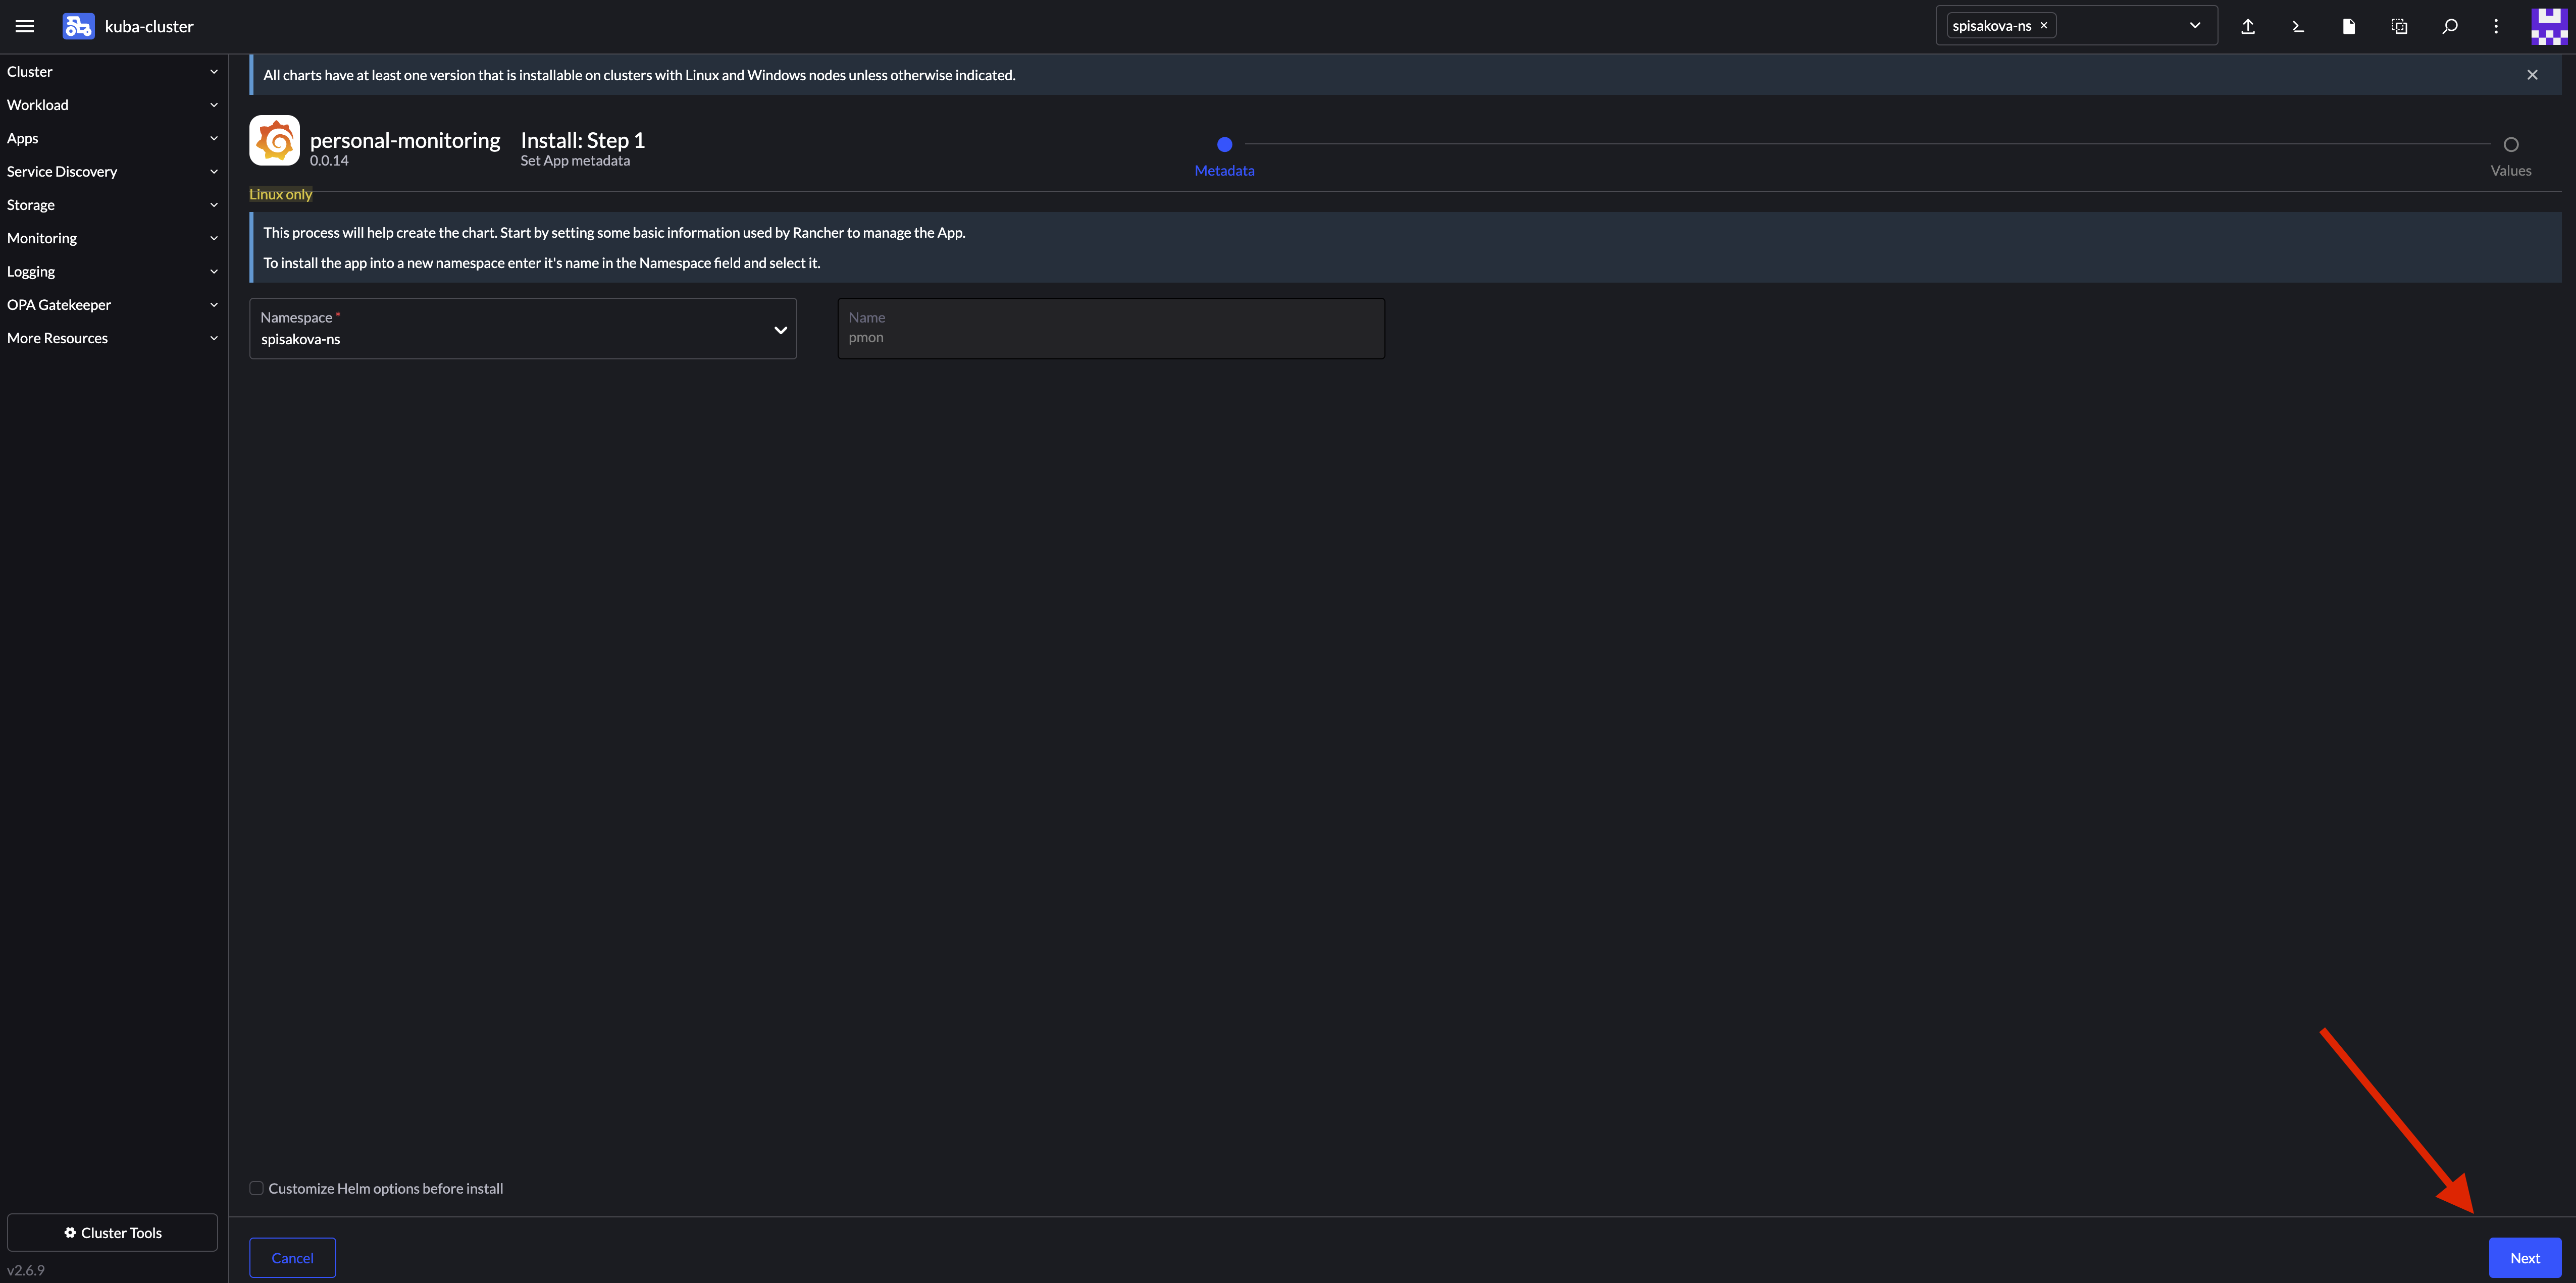
Click Next. It is not possible to change deployed chart name as there can exist only one monitoring per namespace.
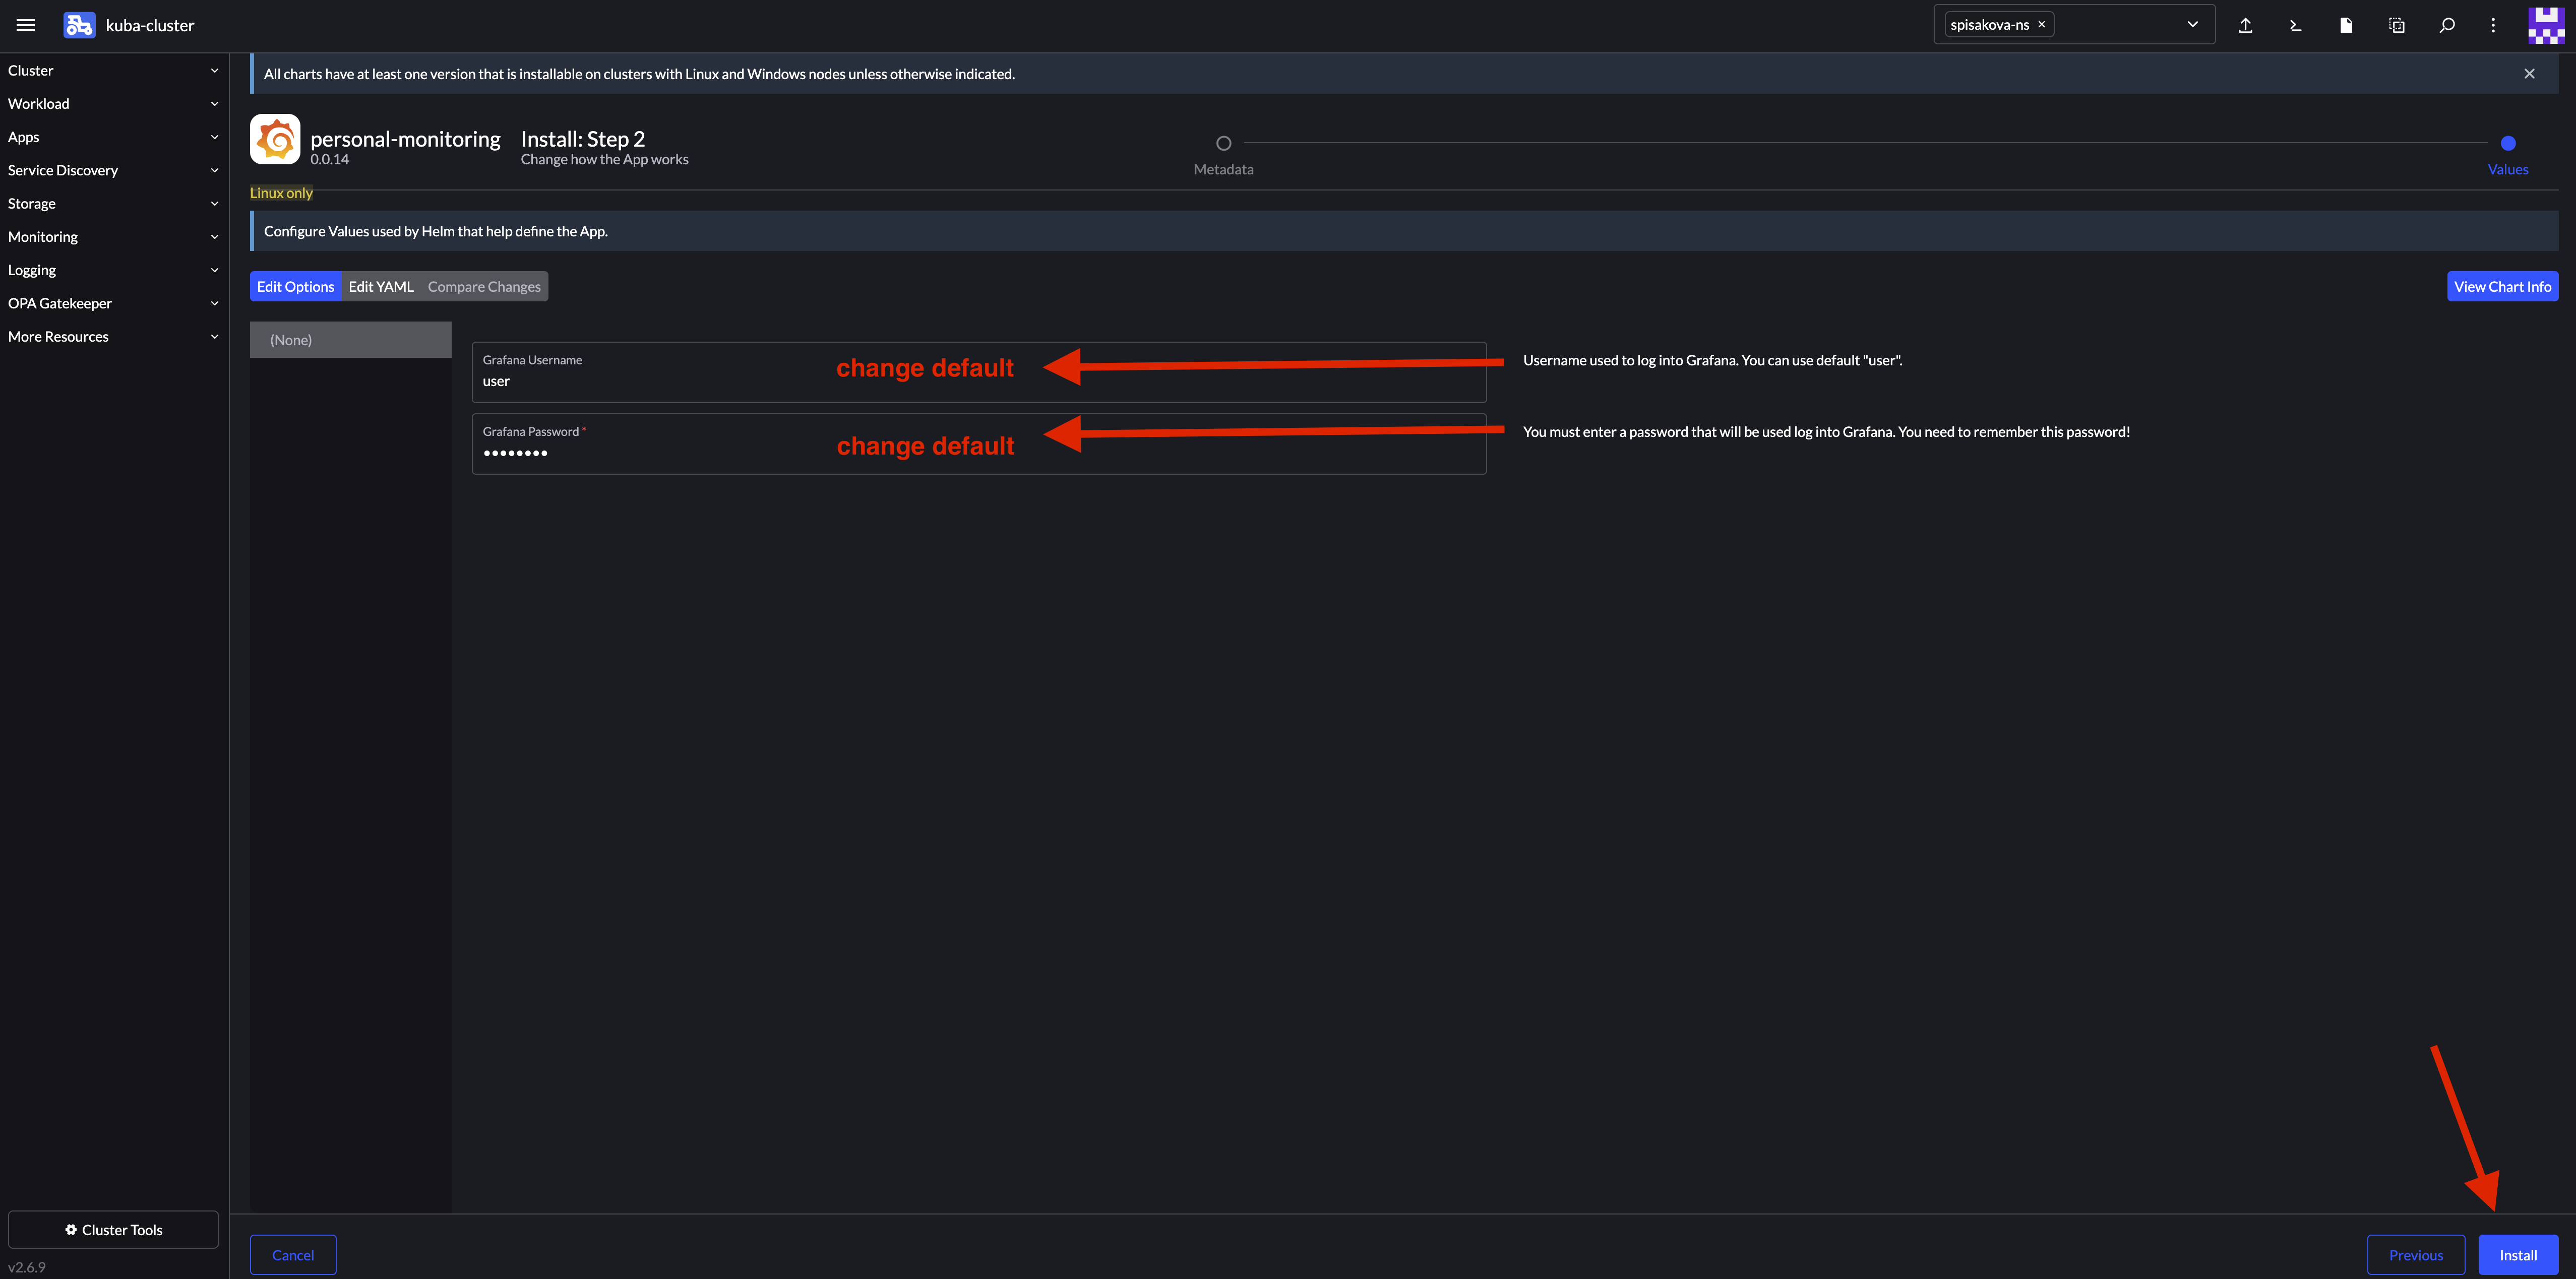
Change default credentials used to authenticate into Grafana instance. Click on Install.
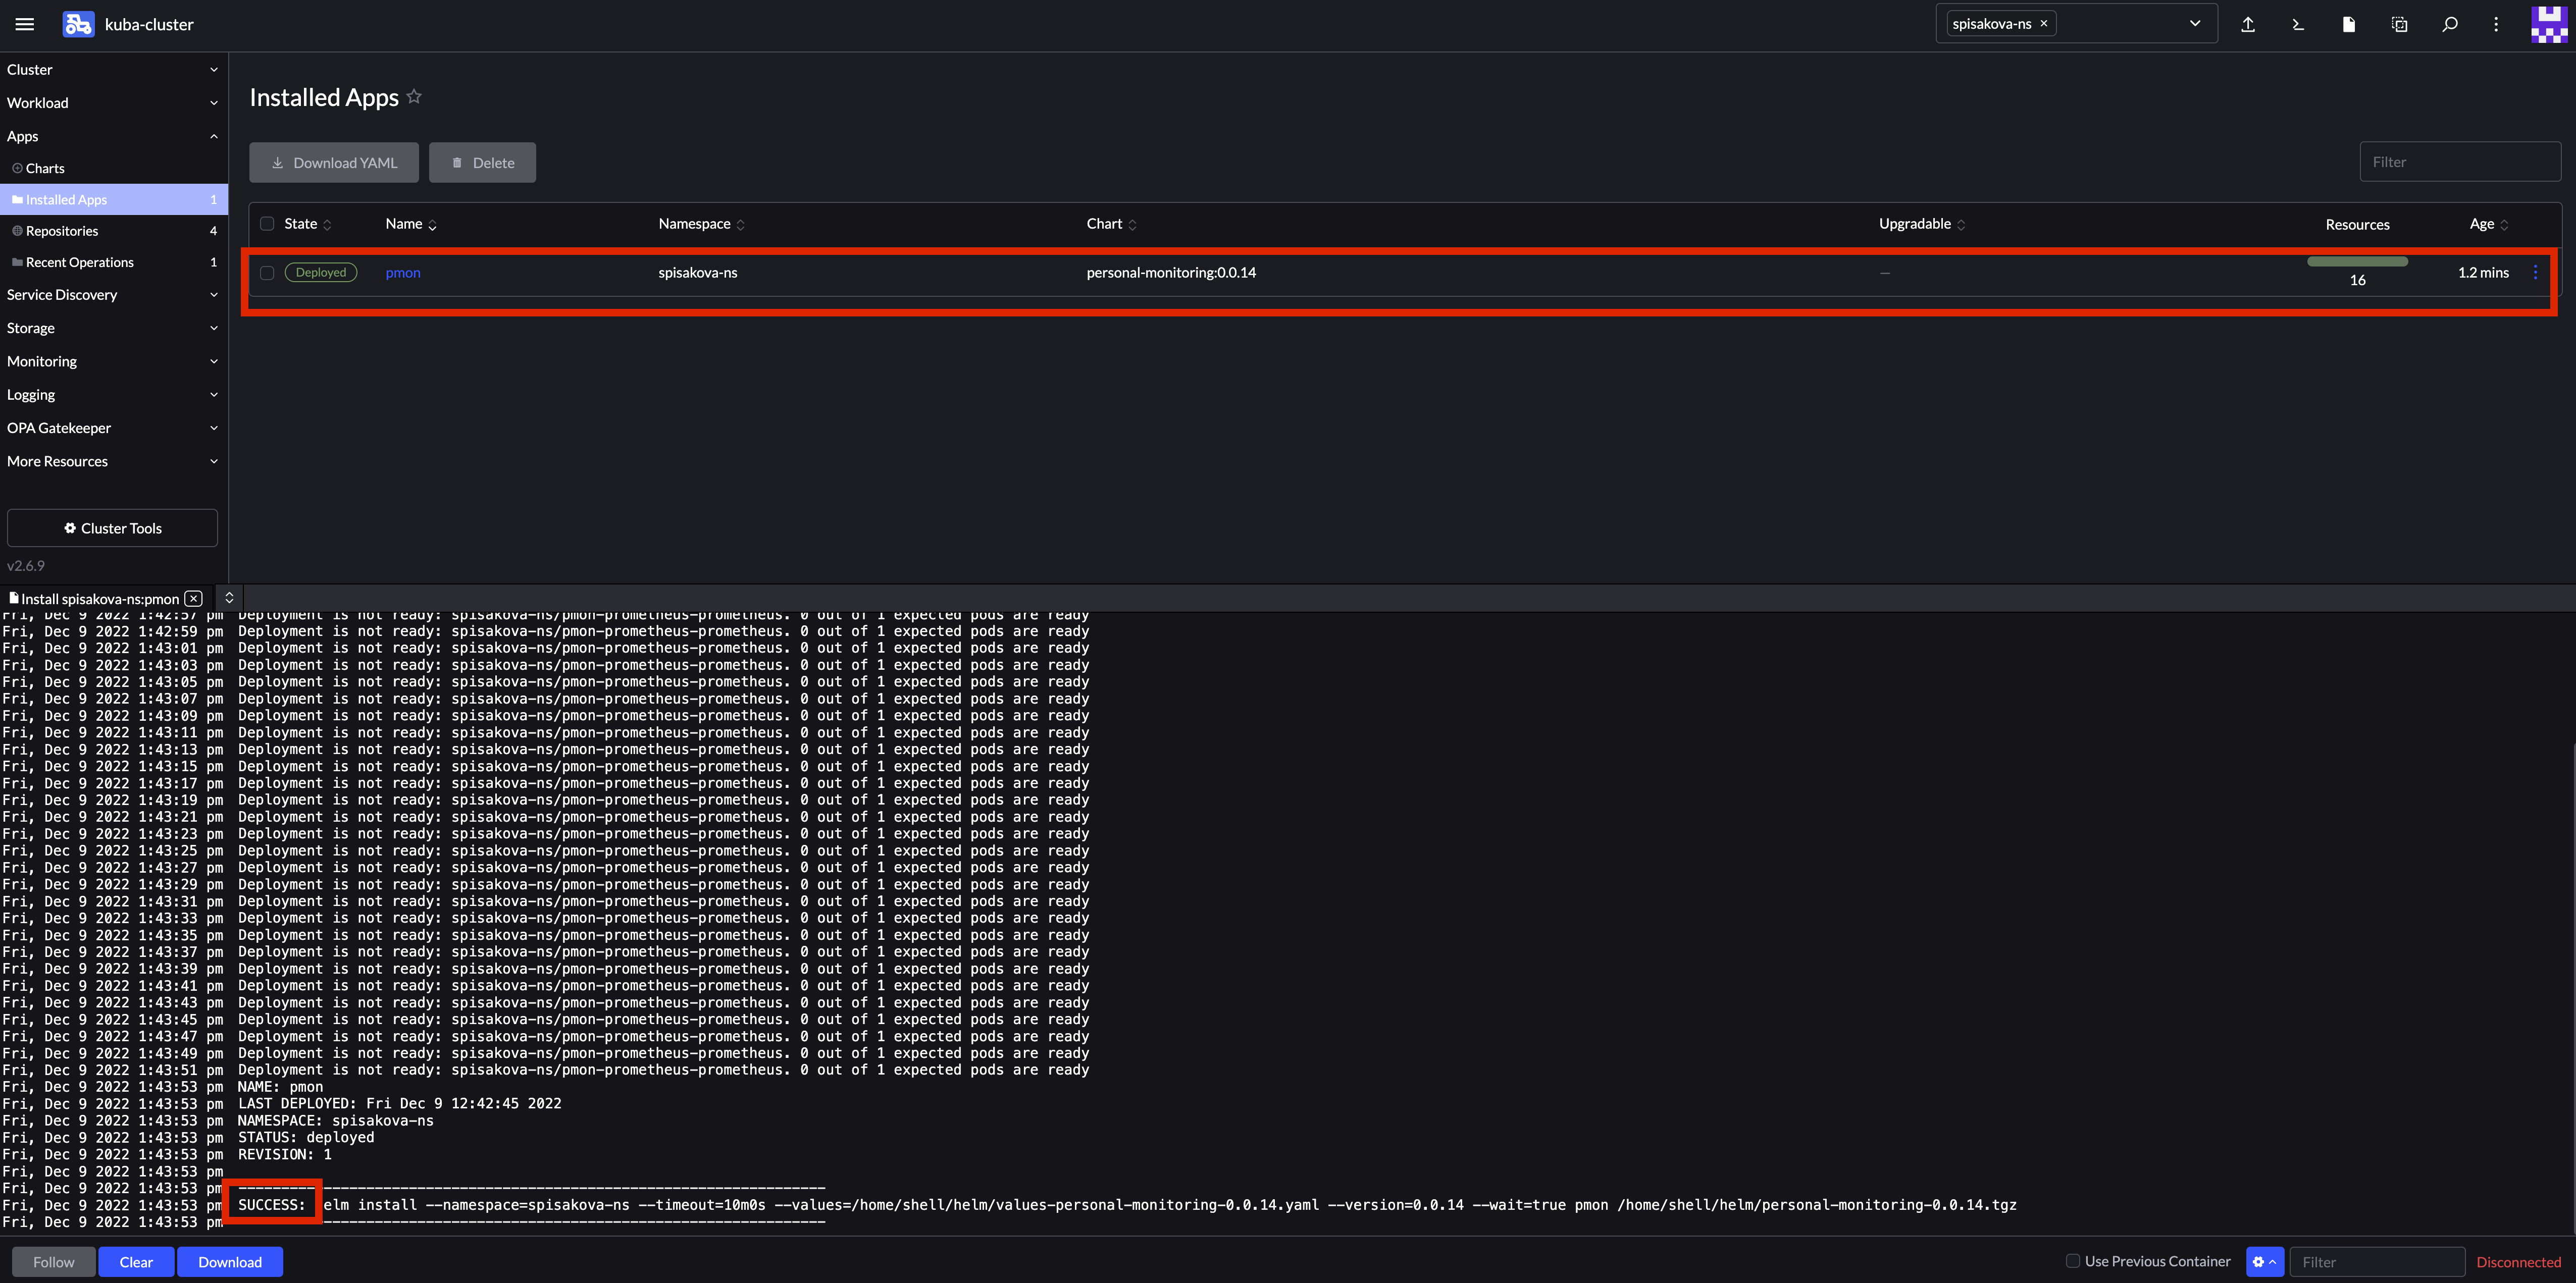
Wait until bottom panel shows SUCCESS and installed app shows green Deployed.
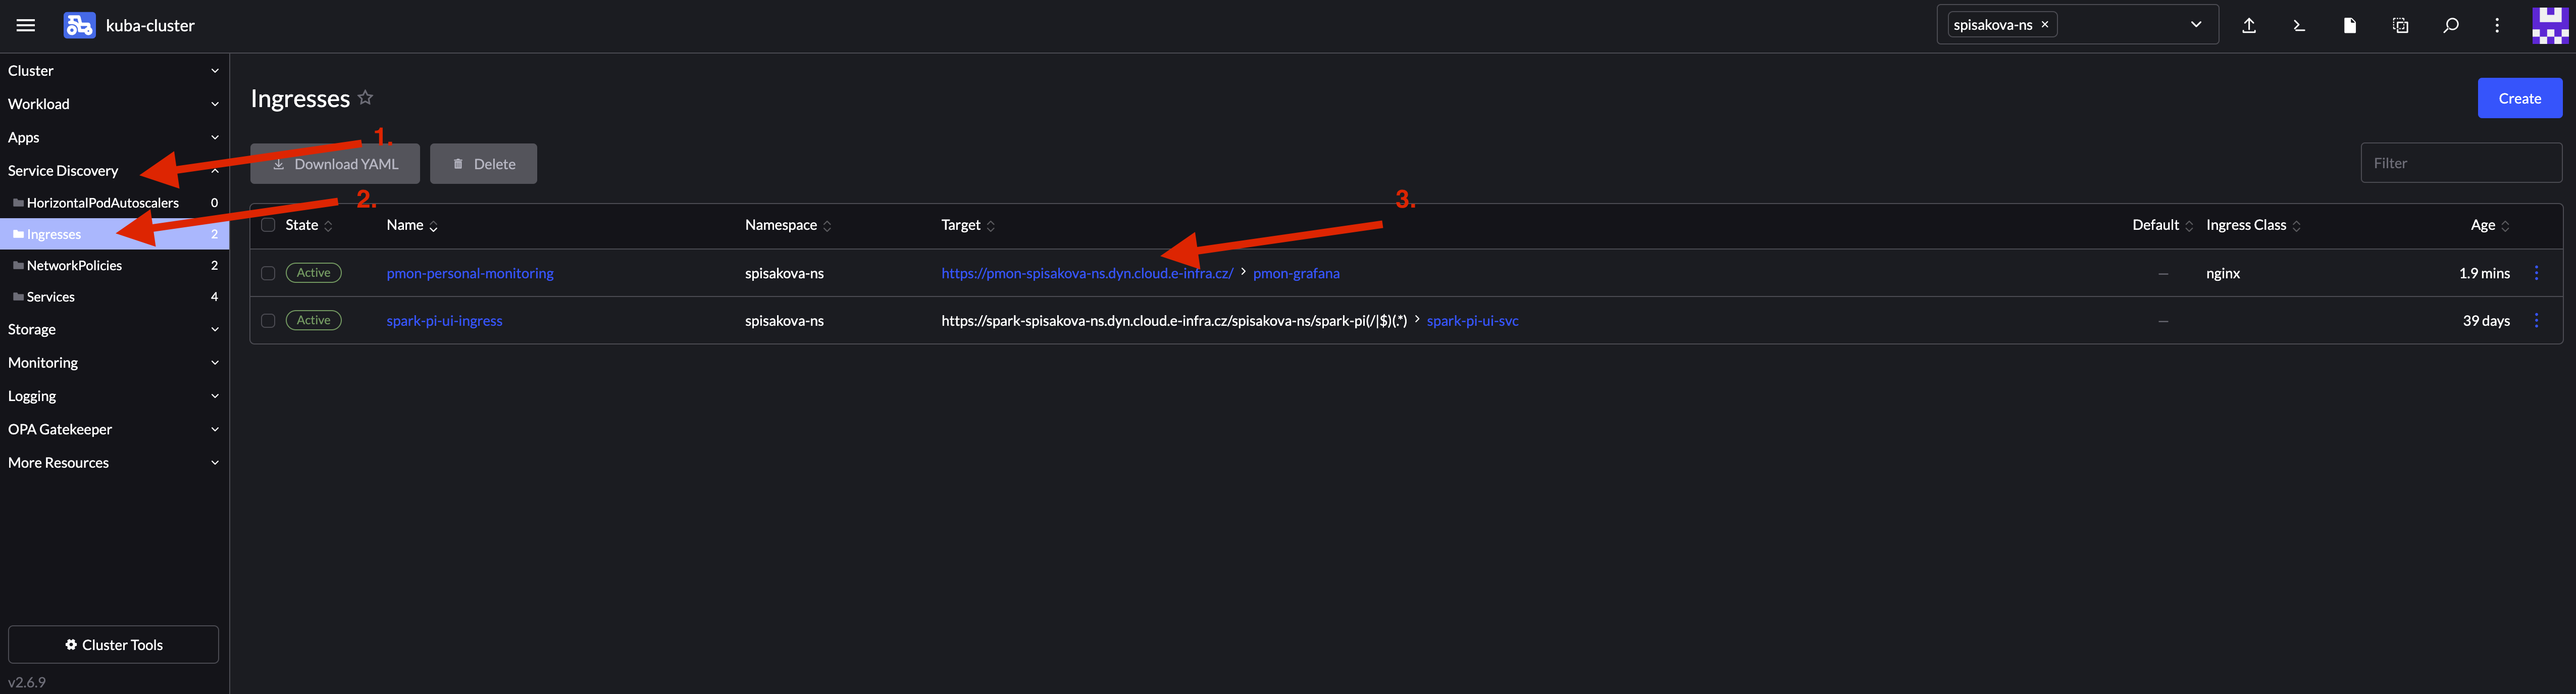
Now you can access your monitoring instance on pmon-[namespace].dyn.cloud.e-infra.cz or find the final address in Ingress tab.
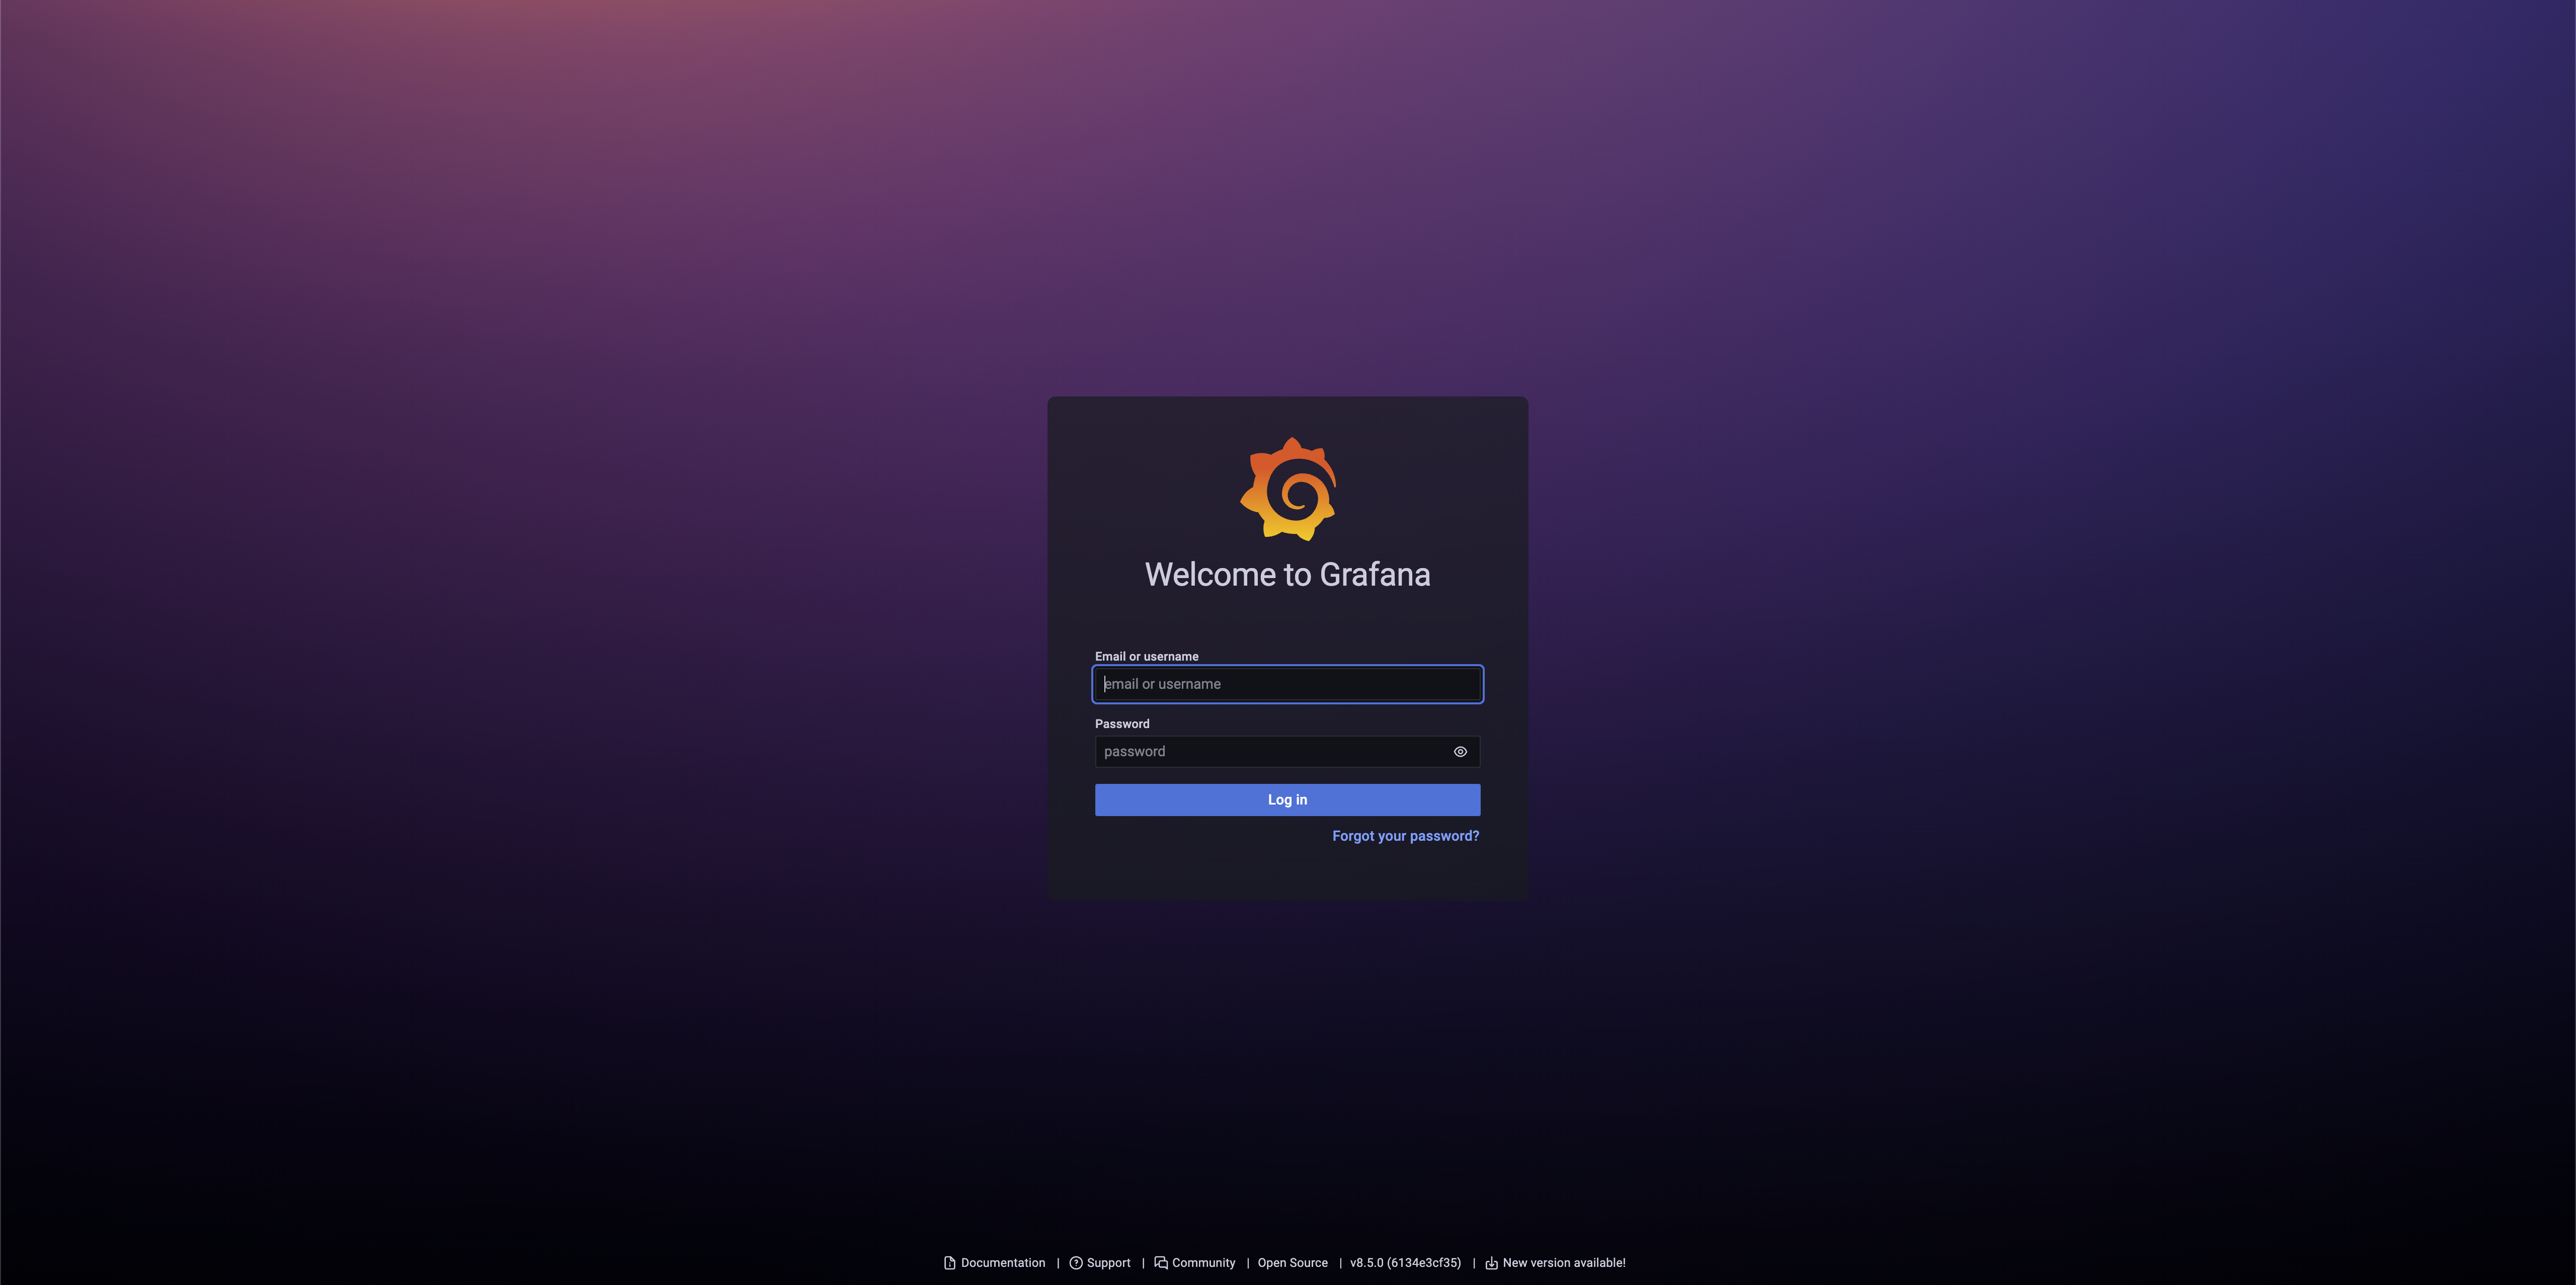
After clicking on the link, you are redirected to your Grafana. Authenticate with credentials you put in the form.